How to Prioritize Your Test Ideas

If you’ve ever thought about improving your store’s conversion rate then you know how it goes.
After doing research and brainstorming you end up with a long list of ideas. Then the realization sets in: how could we possibly do all of these things?
Unfortunately, you can’t. No matter how big your company is you will always have more ideas than you do resources to devote to testing them. This leaves you with two options: prioritize your list or start testing at random.
Testing at random is a surefire way to fail. You may get lucky but without thinking through why you’re running this test and not another one you won’t be able to improve your judgement over time.
Plenty of smart marketers have come to this realization and developed many different frameworks created for prioritizing tests.
All of them have their pros and cons but at the end of the day they are all trying to measure only two variables: potential impact and level of effort.
How to Prioritize Your Tests With These Two Variables
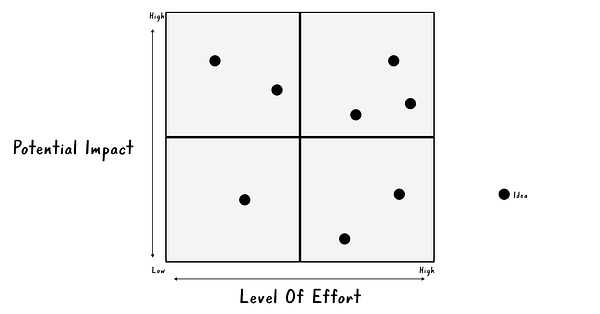
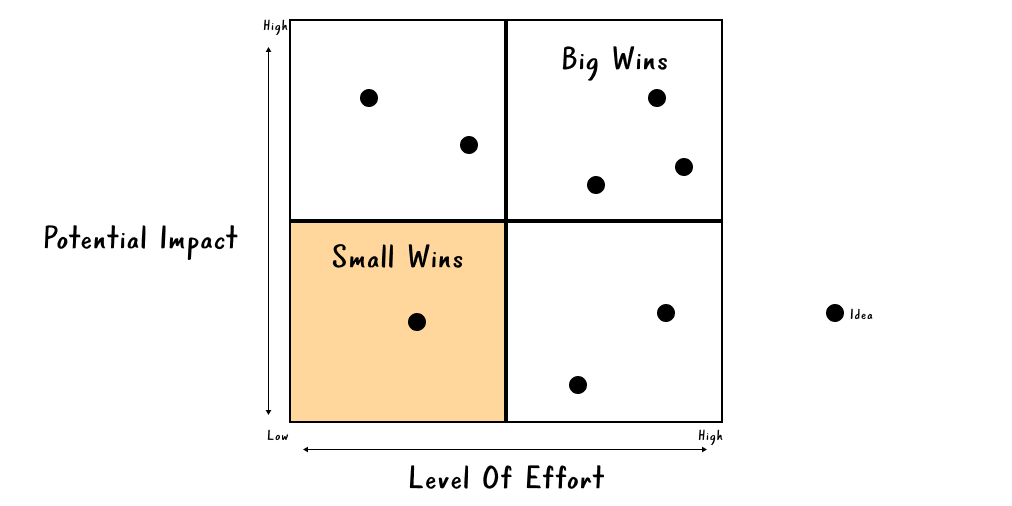
All of your test ideas can be plotted on a 4x4 matrix using these metrics.
For the Y-axis, we’ll use potential impact and for the X-axis we’ll use level of effort.

Potential impact can be thought of as how much you think this change can increase our conversion rate.
Level of effort can be thought of as the amount of time it will take to implement the test. I took this scale from CXL but inverted it for our example:
less than 4 hrs = 1
up to 8 hrs = 2
under 2 days = 3
more = 4
With this measure, 1 and 2 would be in the low effort quadrant while 3 and 4 would be in the high effort quadrant.
You’ve probably already noticed there’s a big challenge here. That is, how do you measure potential impact?
Determining Potential Impact
Potential impact is a tricky thing. No matter how much experience you have you can’t assume you know what type of an impact a given change will have.
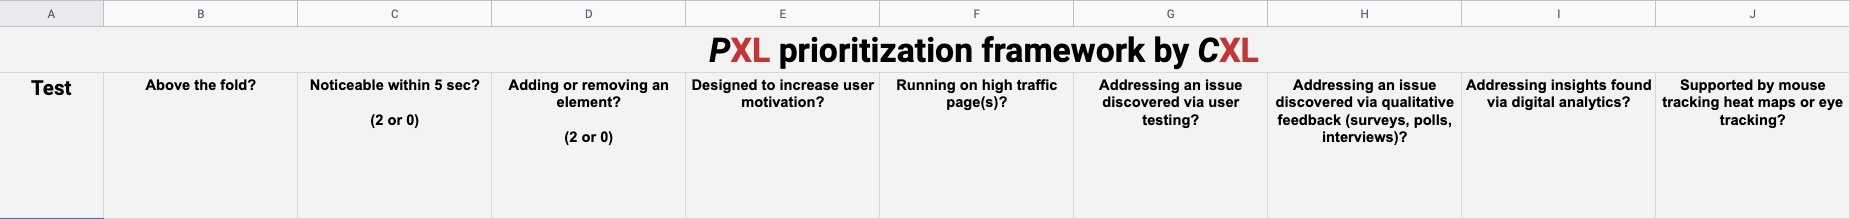
To navigate the difficulty here the smart people at CXL have come up with a framework that evaluates impact on two sets of criteria: properties of the test and the data you have to back it up.
Here are the properties of a test that they want to interrogate:
Is the change above the fold? → Changes above the fold are noticed by more people, thus increasing the likelihood of the test having an impact
Is the change noticeable in under 5 seconds? → Show a group of people control and then variation(s), can they tell the difference after seeing it for 5 seconds? If not, it’s likely to have less impact
Does it add or remove anything? → Bigger changes like removing distractions or adding key information tend to have more impact
Does the test run on high traffic pages? → Relative improvement on a high traffic page results in more absolute dollars.
As detailed, these properties are known from experience to influence a test’s impact.
The data you have to back up a claim is evaluated based on these questions:
Is it addressing an issue discovered via user testing?
Is it addressing an issue discovered via qualitative feedback (surveys, polls, interviews)?
Is the hypothesis supported by mouse tracking heat maps or eye tracking?
Is it addressing insights found via digital analytics?
Each of these questions evaluated with a simple yes or no answer with each of theme weighted based on their influence of an idea’s potential impact.
Assign the scores as shown in the spreadsheet and you will have a good estimate of the potential impact of a test.
You can get your own copy of the spreadsheet here.
Using these measures your potential impact will have a score from 0-11.
0-5 fall in the low impact category and 6-11 fall in the high impact category.
Note: The PXL framework will give you a prioritized list of ideas. But, it’s only one of many frameworks people use. The rest of this post will show a simpler categorization of ideas that’s at the core of every framework.
Prioritizing your list based on these variables
Okay once you have your test ideas plotted on the matrix (or you’ve written down something like high impact/low effort next to each of them) it’s time to actually put them in order.
Anything in the upper-left quadrant (low effort, high impact) is going to be at the top of your list.
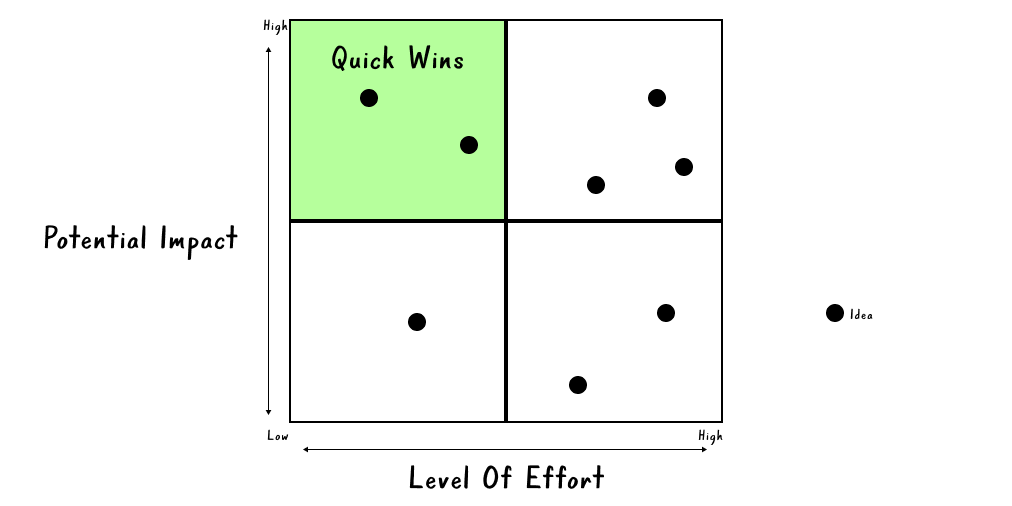
These are your quick wins. You can get them done quickly and they have the potential to have a large impact.
If you’re a new Shopify store that hasn’t been designed by someone with CRO in mind you may have a lot of these. If you’re a more mature site, you probably have fewer.
That’s okay because the next category is where the real work is done. That is your high effort, high impact category. This is your ‘big wins’ category.
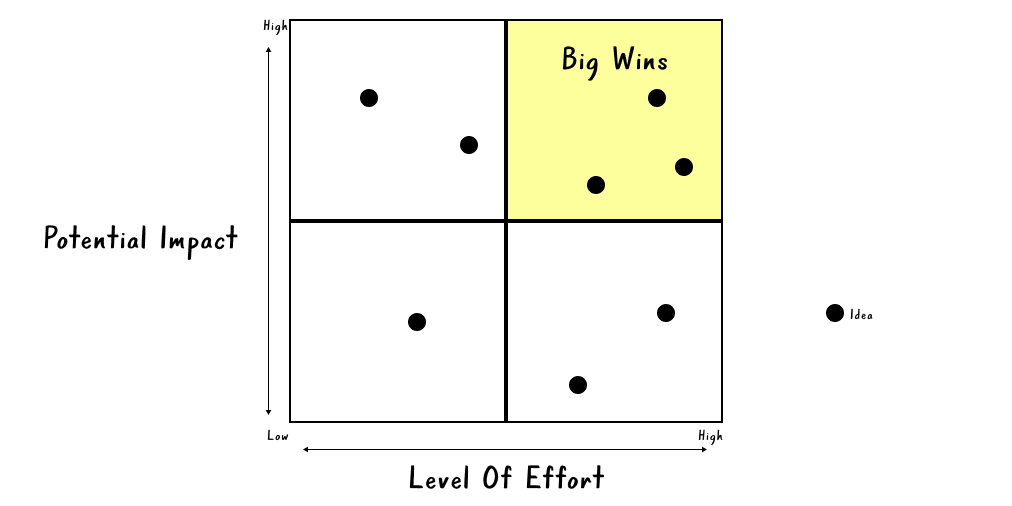
I’ll call this ‘big wins’ because this is where most of your gains are going to come from. The truth is, CRO is hard. Unless you’re a new store you’re not going to have a ton of quick wins. The real work comes from doing things that take time and consideration to move the needle.
It’s important to note that, while these are higher effort, you still may want to do these before a ‘quick win’. Think about it. If a ‘big win’ is going to take a week to implement but has the potential to lift your CR by 30%, whereas a ‘quick win’ has the potential to lift your CR by 10% you may decide to prioritize the big win.
After this you have your low impact, low effort category or your ‘small wins.’
You don’t want to ignore these completely because small improvements do add up over time. Just make sure that you’re focusing on things that have a higher potential impact and work on these when you have spare time or resources.
The final category is your high effort, low impact tests.
Don’t waste your time on these but don’t write them off. You may learn something through other tests or further research that tells you the potential impact is much higher or the level of effort is much lower than you previously thought.
That’s all, folks
Alright, that’s it for issue number 7. If you enjoyed this issue, please share the Twitter thread: