Why Shopify's 'conversion rate' is a terrible metric
Why Shopify's 'conversion rate' is a terrible metric

Hey I’m Shane, welcome to another issue of The CRO Weekly where each week I explore how to build a high converting Ecommerce store. If you’re not subscribed you can do so here:
If you enjoy today’s issue, the best way to support the newsletter is to simply share it with a friend:
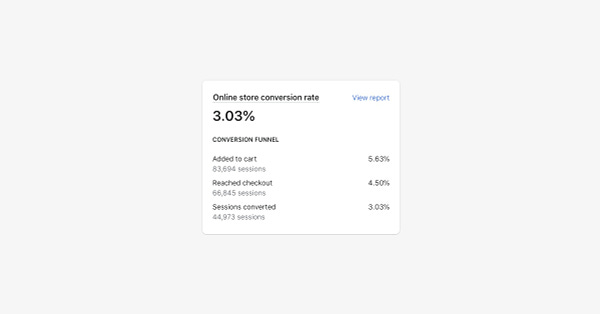
"Online store conversion rate" - you probably look at it every day.
I can't blame you. It’s one of the only metrics to evaluate the quality of your store.
But—even though I'm a “CRO guy”—I have to admit this is one of the worst metrics to track.
An example
Conversion rate is thought to be a measure of the quality of your traffic multiplied by your site's ability to convert traffic.
But imagine you’re a supplement brand looking back on the past week. 100 visitors landed on your site because they googled “How to pick a workout schedule” and clicked through to your blog. Two of them made a purchase for a 2% conversion rate.
Another 100 visitors saw a highly targeted, visually appealing facebook ad that sold the benefits of your product and clicked through to your PDP. Ten of them made a purchase for a 10% conversion rate.
The conversion rate you'll see in your Shopify dashboard is 6% – a blend of both the 2% from organic traffic and 10% from paid.
That's a great conversion rate. You decide that you may be able to improve it even more by changing your cart to be a slide-out drawer instead of a separate page. Luckily, your theme has a “cart type” setting, so it's just a one-click update.
The following week
Another week has gone by and your conversion rate has tanked! Your ‘online store conversion rate’ is down to 4%. Why does everyone use these cart drawers anyway?
But in reality your SEO consultant is crushing it. Your article is taking over top spots in Google and this week 300 visitors landed on your site from the “How to pick a workout schedule” article. Six of them converted for a 2% conversion rate.
Your Facebook spend stayed flat and another 100 visitors came through the facebook ad. Again, ten of them converted for a 10% conversion rate.
Paid traffic is still converting at 10% and blog traffic at 2%. So where is the 33% drop in conversion rate coming from?
Week 1:
Organic: 2 / 100 = 2%
Paid: 10 / 100 = 10%
Total: 12 / 200 = 6%
Week 2:
Organic: 6 / 300 = 2%
Paid: 10 / 100 = 10%
Total: 16 / 400 = 4%
You’re seeing the drop because more people are converting at 2% than at 10%. So while your “online store conversion rate” dropped 33%, your real conversion rate stayed flat.
The problem with looking at day-to-day numbers
This is the problem with conversion rate as a metric. The calculation is so simple that every visitor and every purchase is weighted equally.
Even if you segmented down to look at paid traffic vs organic, there are still a ton of ways your conversion rate can change day to day:
Your best selling product is out of stock
Your best selling variant is out of stock
You ran a sale or promotion
You stopped selling a product
You added a new product to your store
The stock market crashed
A worldwide pandemic kicked off
The government gives everyone $1200
None of these require you to make a change to your store. Yet they can cause massive day-to-day and even month-to-month swings in your conversion rate.
The case for AB testing
When so many things can change your conversion rate day-to-day, or week-to-week, you can't rely on historical data. Whether you try to compare the month before you made a change to the month after, or one month compared to the same month last year, it's all a complete mess.
Try to compare March 2020 (the start of a global pandemic) to March 2021 – it wouldn’t make much sense.
The only scenario in which conversion rate is a reliable metric is within an AB test.
Consider our contrived example—instead of seeing 200 visitors and 12 conversions the first week with 400 visitors and 16 conversions the second week, we could have run a test over the two weeks.
In the test, 100 visitors from the first week would see version A and 100 would see version B. Then 150 visitors from the second week would see version A and 150 would see version B.
Since the cart drawer had no effect on our real conversion rate, we would likely see the following stats:
Version A: 300 visits and 13 conversions (4.3%)
Version B: 300 visits and 13 conversions (4.3%)
Instead of comparing one week to the next, the different traffic sources get segmented into the different variations and taken in aggregate.
In this very narrow, isolated context your conversion rate is a great indicator of what works.
So the next time you look at your Shopify analytics and see a drop in conversion rate don’t freak out. It probably means nothing.
Thanks for taking the time to read this week’s issue. I’d love to talk about it with you here on Twitter: